Tip #1229: Use math to make your chart look good

Multicolored abacus standing upright

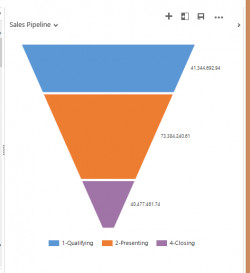
It’s Friday afternoon and the management asked you to create a quick chart illustrating your team’s bug handling pipeline. Easy-peasy. Step 1 – extract data from the Squash-A-Bug system Status Count New 4268 Under Review 1921 Planned 516 Completed 229 Step 2 – visualize it as a small dashboard: That…. does not… look… good… (tried […]

Tip #168: Renumber the pipeline stage

When you use Business Process Flow, the stages are categorized using the stage category option set. The categorization allows you to have standard process stage categories across multiple processes. While your various process flows may have stages with different names, the stage category provides consistency between process flows and allows you to chart opportunities with […]