 of the
After a brief interruption, we continue the chart week fortnight by Ulrik “CRM Chart Guy” Carlsson.
Do you need more descriptions in your charts, or maybe add a little corporate branding, look no further than the Advanced Chart Editor for the XrmToolBox.
You can add more text to your charts via a node called annotations.
In the Advanced Chart Editor for the XrmToolBox, open the chart you want to add annotations to.
Sometimes the Annotations show up automatically. If they do not, complete these two steps first.
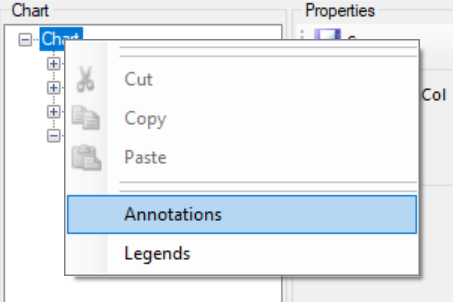
Right click on the main “Chart” property and add the Annotations.
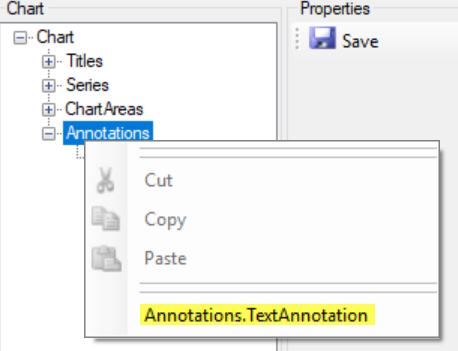
Right click on the annotations and add a TextAnnotation.
Select the TextAnnotation and fill in the properties.
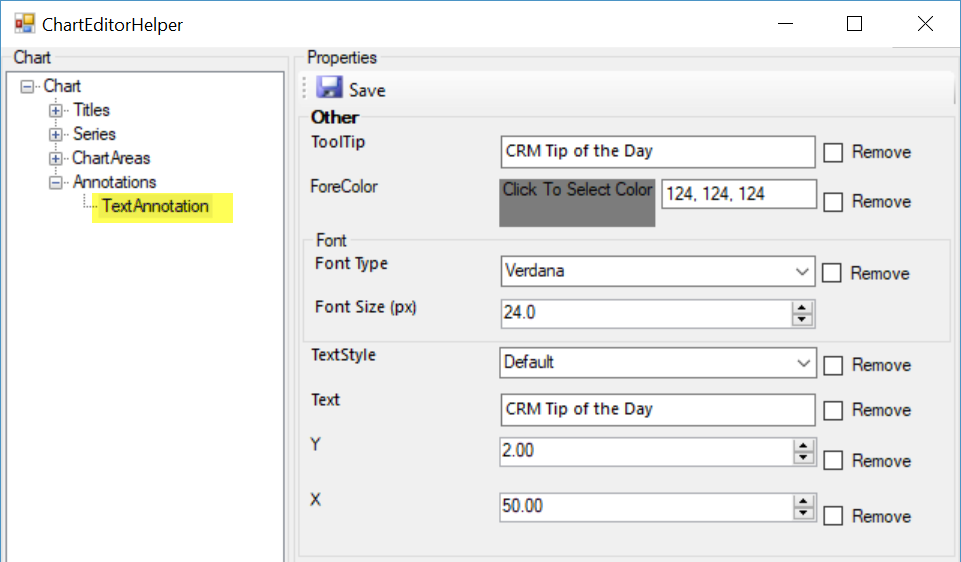
The X and Y values controls the positioning of the annotation.
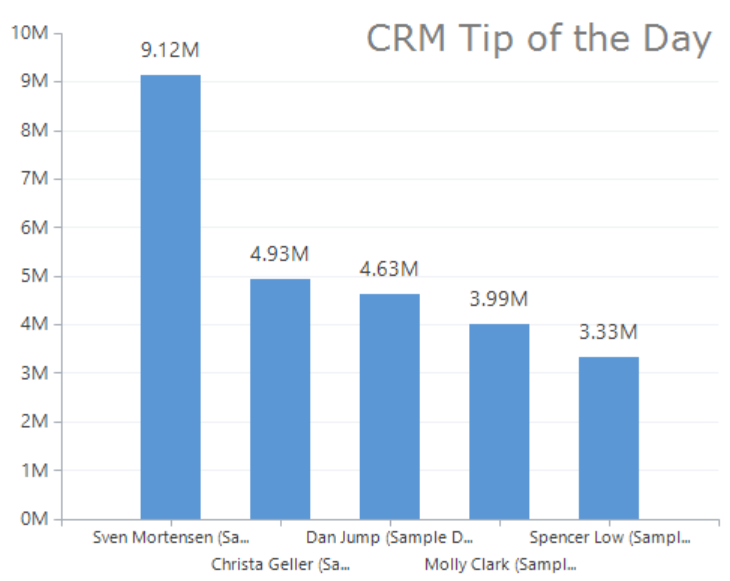
You can add more than one TextAnnotation if you need more descriptions in different places on the chart.