 of the
Nasty rumors (and this official page from Microsoft) claim that you cannot create personal charts from Unified Interface.
This is not true anymore.
From any view in your unified interface model-driven app, click “show chart” then under the more options (…) menu, click “+ new.”
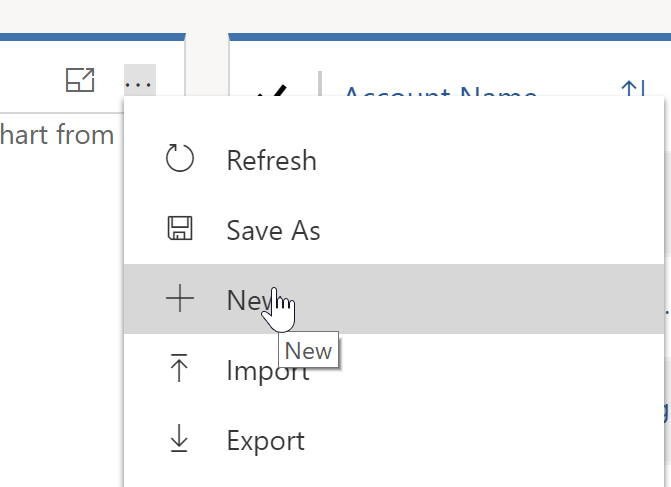
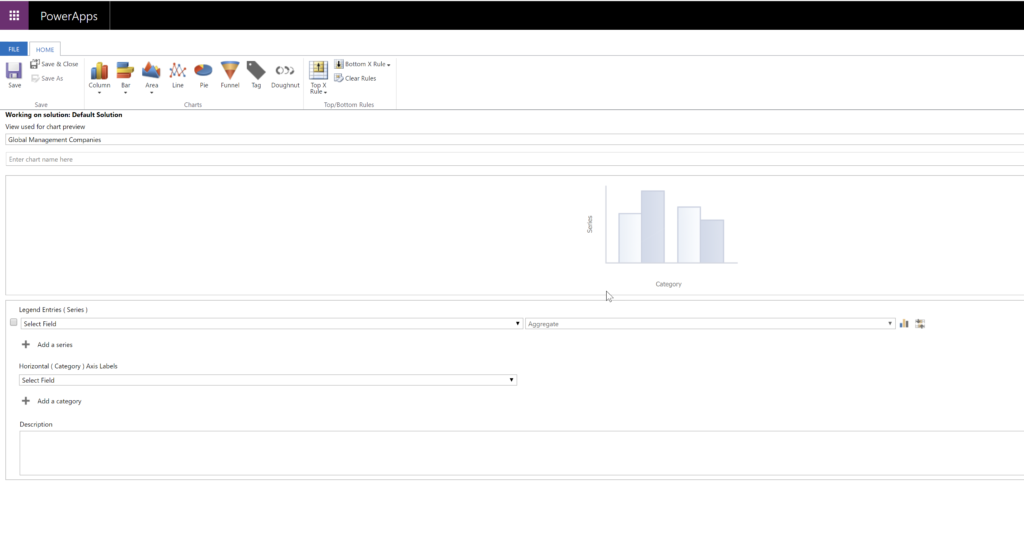
This will launch the classic chart builder in a new window.
And BTW, audit logs are also now available. So what are you waiting for?
Thanks Rob Dawson for the tip. Send your tips to jar@crmtipoftheday.com
Cover photo by Ioana Cristiana
Now if only we could get an update to OnPremise!
I am struggling with another issue – Displaying charts on forms in the unified interface. As I understand, you cannot display charts on forms in the unified interface.
Is there a workaround ? e.g. is it possible to embed a chart within an iframe and display the iframe in the unified interface ? Will that work ?
Have you tried it? It’s supported.
Hi Joel,
I’ve tried, and it displays the view instead of the chart. Note that the chart displays correctly in the old UI, but doesn’t display on the Unified interface. We are on version 9.0.4.5 on-premise
Not sure about on prem but online 9.1 works as long as you check the box to only display the chart. It can’t display the chart and view
I can create personal chart in Unified interface, but I’m not able to select personal view for the chart. What I’m doing wrong?
I raised this issue with MS Support. They are working on it, but it seems to be a functionality gap between UCI and the web client. So far no eta on the fix 🙁
Can’t you create your chart with a system view and then select it for the inline visualization of a personal view? the chart isn’t tied to a specific view–you can use whatever view to create the chart, then use it on any view system or private.
Hey, I have a strange behavior with the inline-chart.
I have a plugin running that filters the opportunity grid. So if there are 3 opportunities without the plugin with 300k est. Revenue in total, there will be showing only two with total est. Revenue of 250k. This works as expected.
Now, if I open the chart, there is a sum(est. Revenue) rule which always shows 300k instead of the filtered 250k.
Is this a CRM bug? Have you ever experienced something like that?
Thx!