 of the
Want to add some sizzle to you form configuration? Phil Dudovicz recommends using visual controls with calculated fields to create a nice looking dashboard in your Dynamics 365 Unified Interface form. The following is an example of an investor form that visually displays relevant investor data.
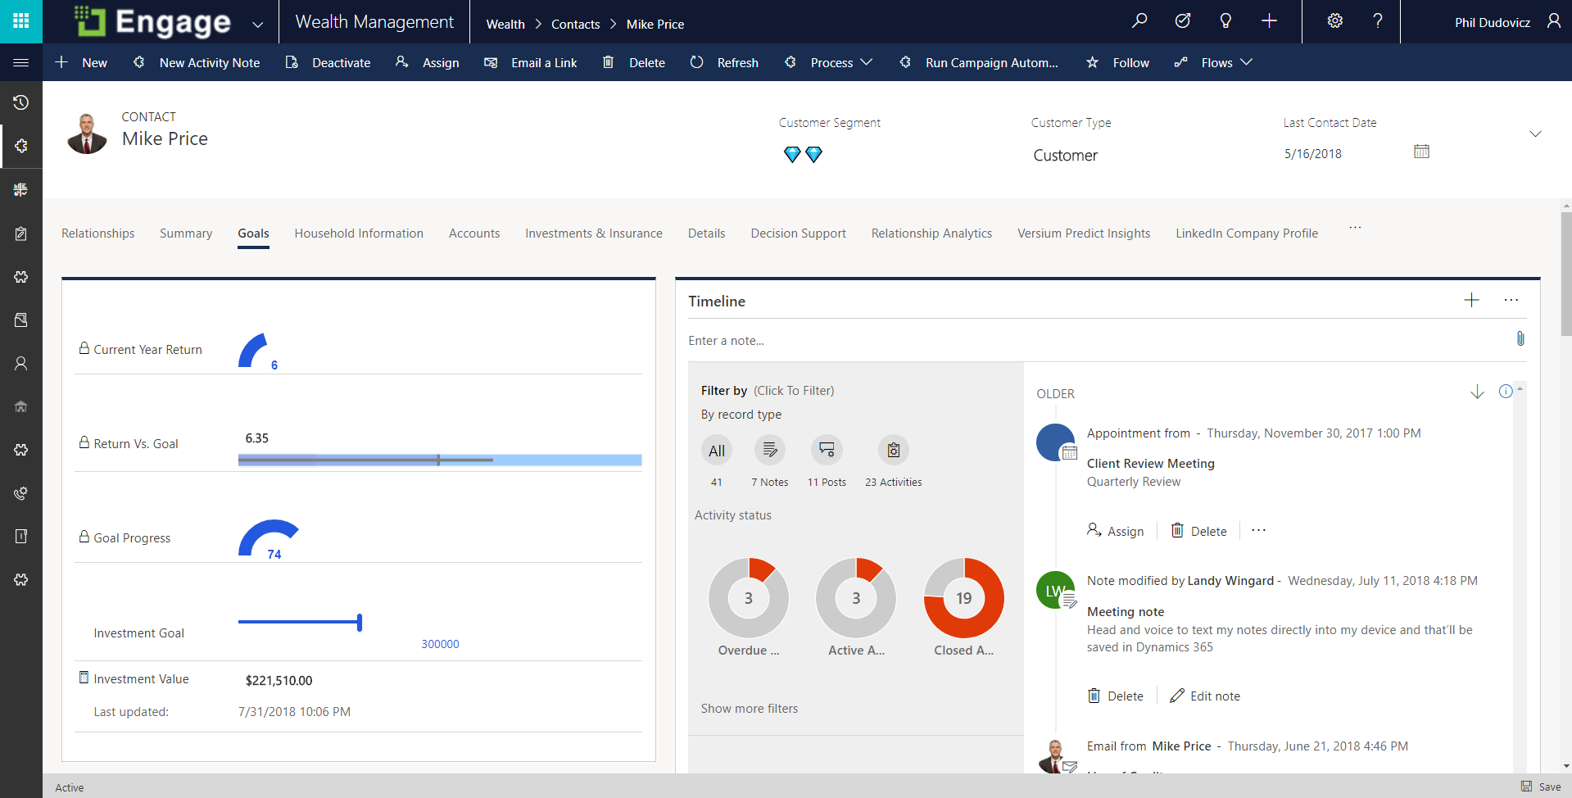
Let’s take a closer look at how this is built:
- Current Year return

- Calculated Field
- Data Type: Decimal Number
- Field Type: Calculated
- ((new_investmentvalue – new_investmentvaluejan1) / new_investmentvalue) * 100
- Control: Arc Knob
- Value: hsl_currentyearreturn
- Min: .1
- Max: 15
- Step: .1
2. Return vs. Goal

- Data Type: Decimal Number
- Field Type: Calculated
- (new_investmentvalue / new_investmentgoal) * 100
- Control: Arc Knob
- Value: hsl_goalprogress
- Min: 0
- Max: 100
- Step: 1
By combining visual controls with calculated fields you can easily add visual context to a record and give your users a richer user experience.
Thanks for the tip, Phil. Do you have a tip for us? Send it to jar@crmtipoftheday.com.
Awesome idea… cannot wait to use this